# Overview
kube+ leverages Loki (opens new window) as a native component to fetch and display logs from any application running in the platform.
It does not require any additional configuration, your application logs are retrieved and visible in Grafana by default!
# Fetching application logs in Grafana
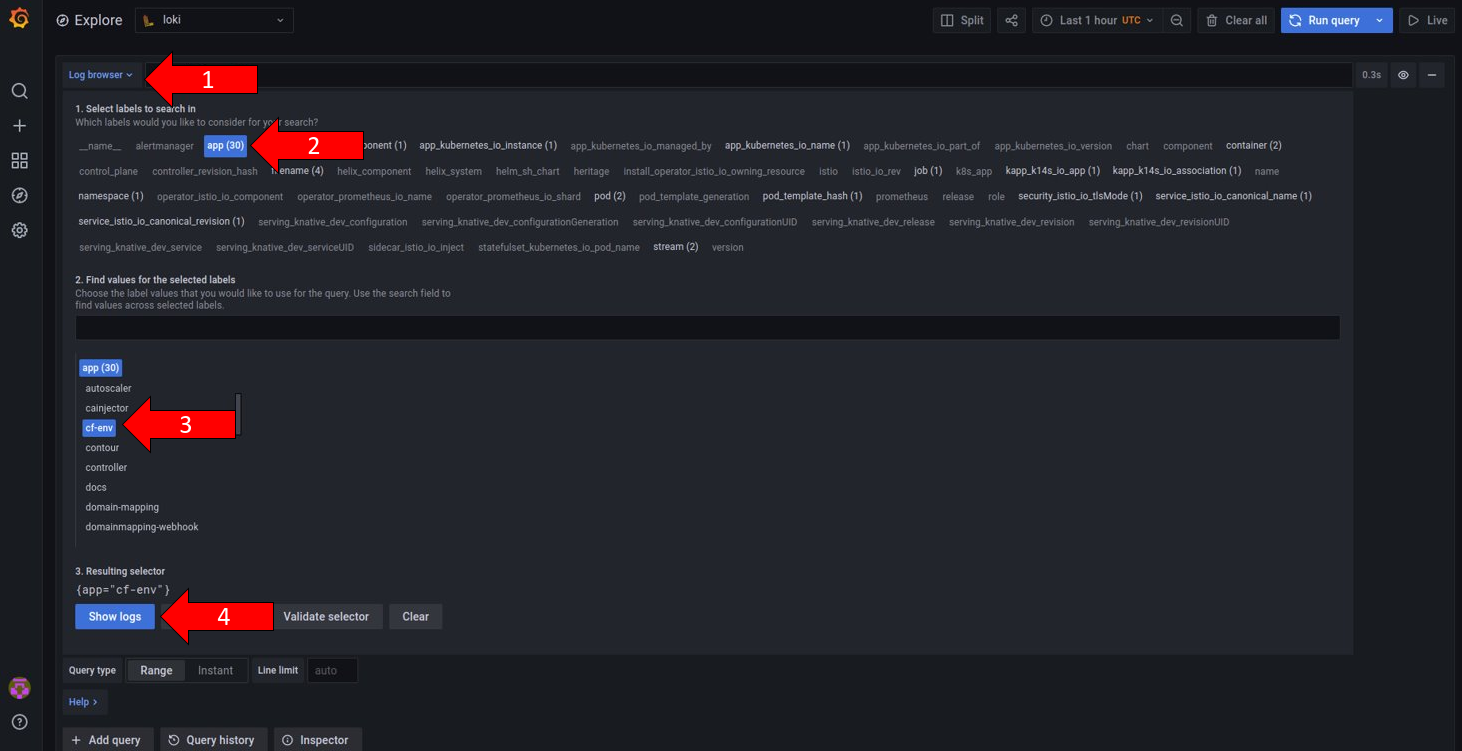
Open the Grafana Explore dashboard (opens new window) and click on Log browser. Different labels will be shown which you can use to filter application logs. After selecting the desired label find the value corresponding to your search and finally Show logs.
Alternatively, you can write your own queries (opens new window) to retrieve any logs.
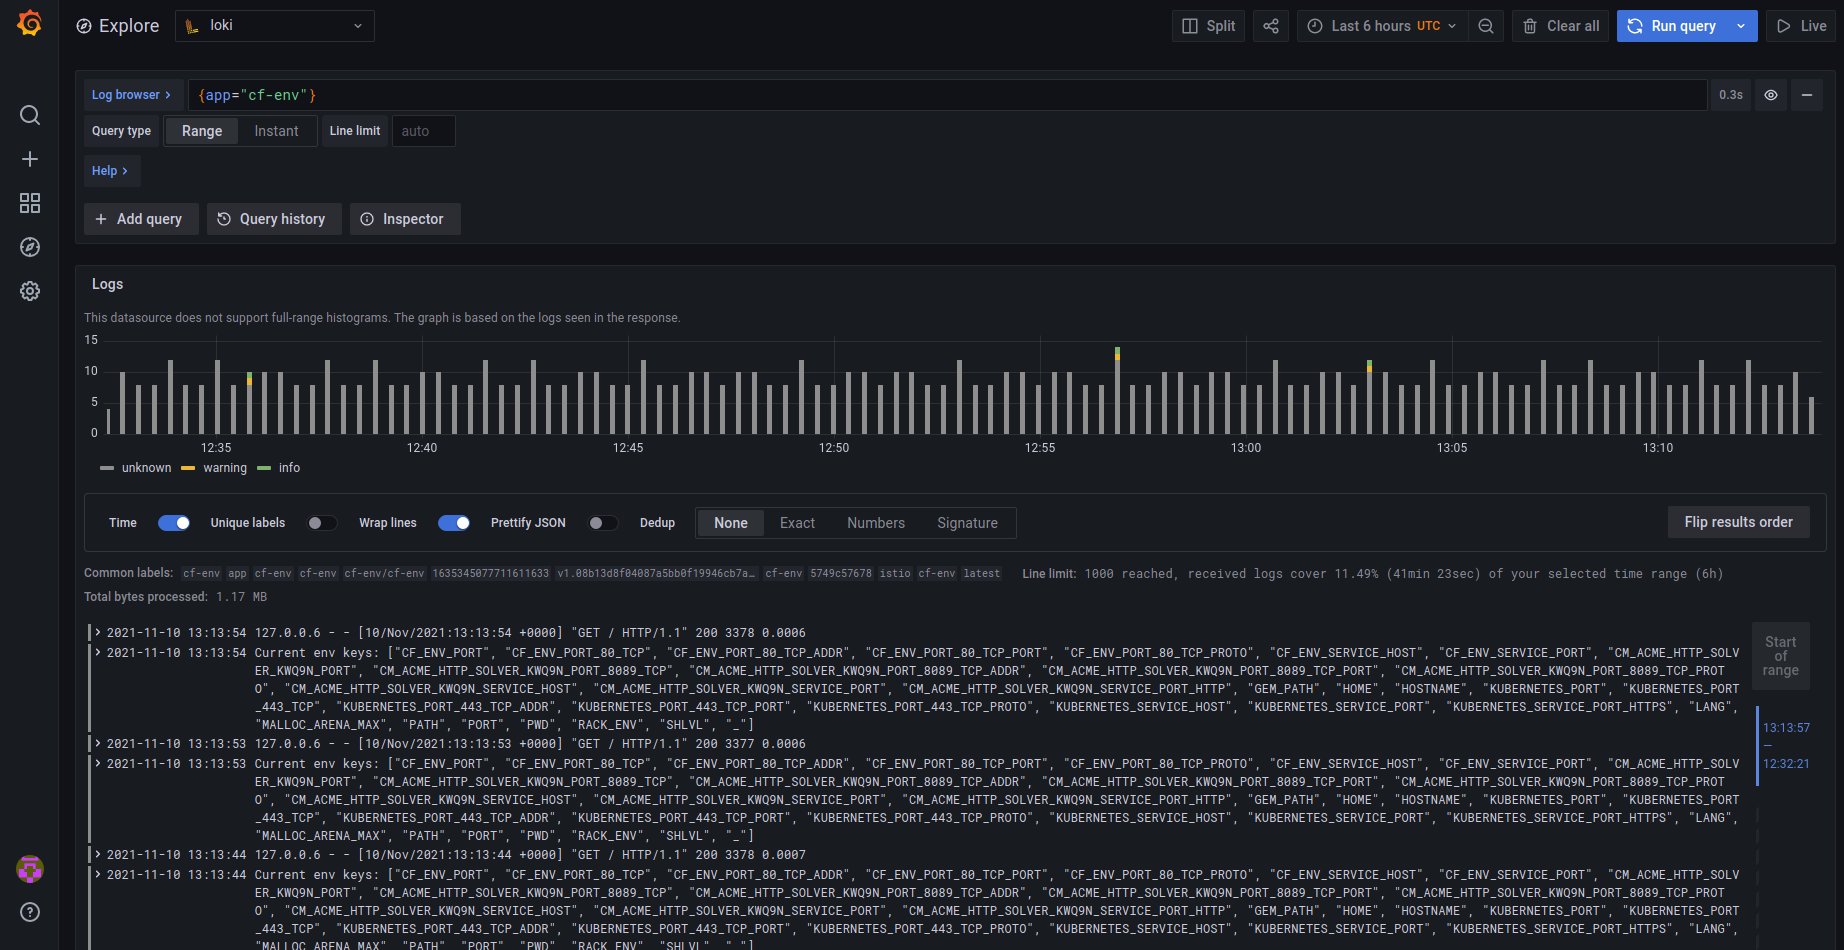
The application logs will be displayed as follows: