# Overview
# Quick Tutorial
Monitoring applications on kube+ is quick and easy. This tutorial focus on how you can retrieve and visualize custom metrics from a sample application deployed with Knative with just a couple of additional steps. As pre-requisite, it is recommended to have a basic knowlegde of Knative. Please check the workload section for more information.
# Deploy an application
First, we adapt the prometheus-example-app (opens new window) to be deployed as a Knative service as shown below.
This application has a set of pre-defined metrics (opens new window) exposed on port 8080 which then can be configured to be automatically scraped by the Prometheus-Operator.
# prometheus-metrics-demo.yaml
apiVersion: serving.knative.dev/v1
kind: Service
metadata:
  name: prometheus-metrics-demo
  namespace: demo
spec:
  template:
    metadata:
      labels:
        serving.knative.dev/service: prometheus-metrics-demo
    spec:
      containers:
      - image: quay.io/brancz/prometheus-example-app:v0.3.0
        ports:
        - containerPort: 8080
$ kubectl -n demo apply -f prometheus-metrics-demo.yaml
service.serving.knative.dev/prometheus-metrics-demo created
Once the application has been deployed, open https://prometheus-metrics-demo.demo.kube-plus.cloud (opens new window) in browser to see your application up and running.
Then open https://prometheus-metrics-demo.demo.kube-plus.cloud/metrics (opens new window) to see the different custom metrics this application provides.
# Deploy a Service Monitor
The monitoring solution leverages Prometheus-Operator (opens new window) for its core components. Scraping your custom metrics can be done in multiple ways, by setting annotations on pod metadata or by configuring ServiceMonitors (opens new window) or PodMonitors (opens new window) as these resources are provided by the Prometheus Operator. For more information on the different methods that can be used to scrape metrics please this page.
For our Knative service, a ServiceMonitor will be deployed to scrape the metrics from the application. As shown below:
# prometheus-service-monitor.yaml
apiVersion: monitoring.coreos.com/v1
kind: ServiceMonitor
metadata:
  namespace: demo
  name: prometheus-sv-monitor
spec:
  selector:
    matchLabels:
      serving.knative.dev/service: prometheus-metrics-demo
  endpoints:
    - targetPort: 8080
$ kubectl -n demo apply -f prometheus-service-monitor.yaml
servicemonitor.monitoring.coreos.com/prometheus-sv-monitor created
Note that targetPort as well as label selector defined in the ServiceMonitor matches with the configuration of the application.
Now open the Prometheus dashboard at https://prometheus.demo.kube-plus.cloud (opens new window) and search for version in the UI to see your new metrics in place. Alternatively, use the Grafana dashboard (opens new window) to explore your new metrics. The application metrics may take up to 60 seconds to appear in the dashboard after its deployment, this is due to the default scrape interval configured by Prometheus Operator.
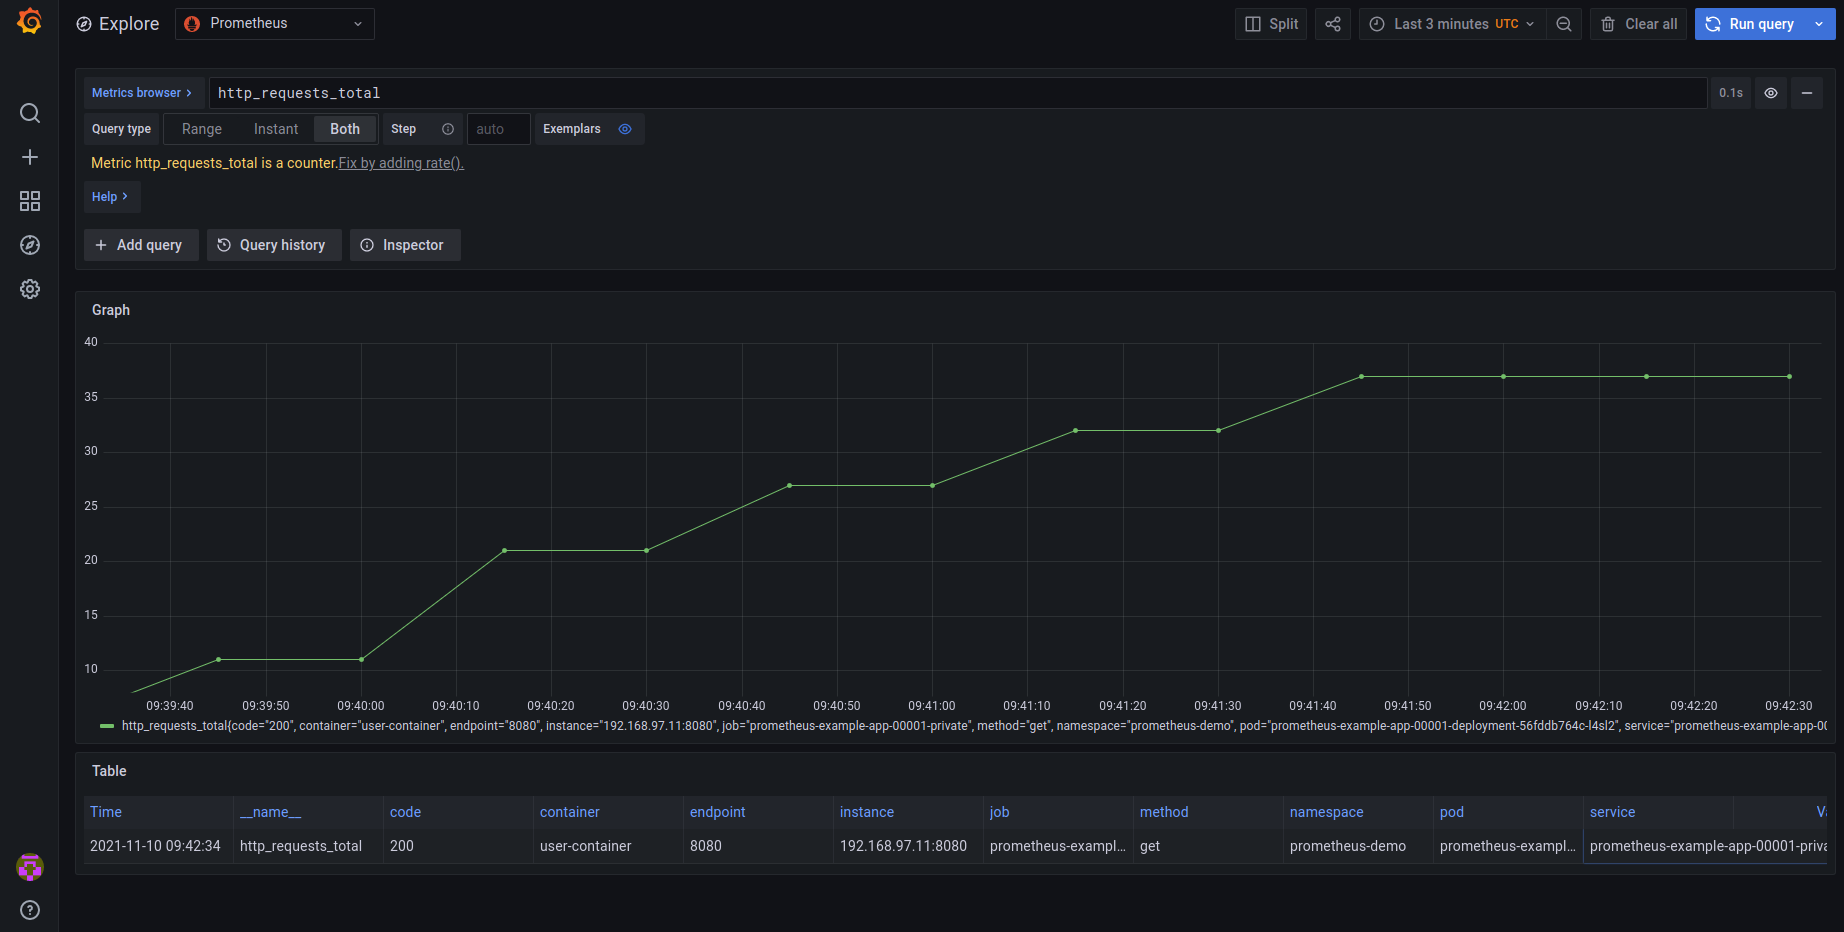
Below a screenshot of the custom metric http_requests_total added to Prometheus by the sample application:
# Knative default metrics
Deploying applications with Knative has many benefits. From a monitoring perspective, Knative exposes a set of metrics (opens new window) by default on port 9090 and 9091. If those metrics are of interest, you can simply extend the endpoints configuration in the ServiceMonitor as shown below:
# prometheus-service-monitor.yaml
apiVersion: monitoring.coreos.com/v1
kind: ServiceMonitor
metadata:
  namespace: demo
  name: prometheus-sv-monitor
spec:
  selector:
    matchLabels:
      serving.knative.dev/service: prometheus-metrics-demo
  endpoints:
    - targetPort: 8080
    - targetPort: 9090
    - targetPort: 9091
$ kubectl -n demo apply -f prometheus-service-monitor.yaml
servicemonitor.monitoring.coreos.com/prometheus-sv-monitor created
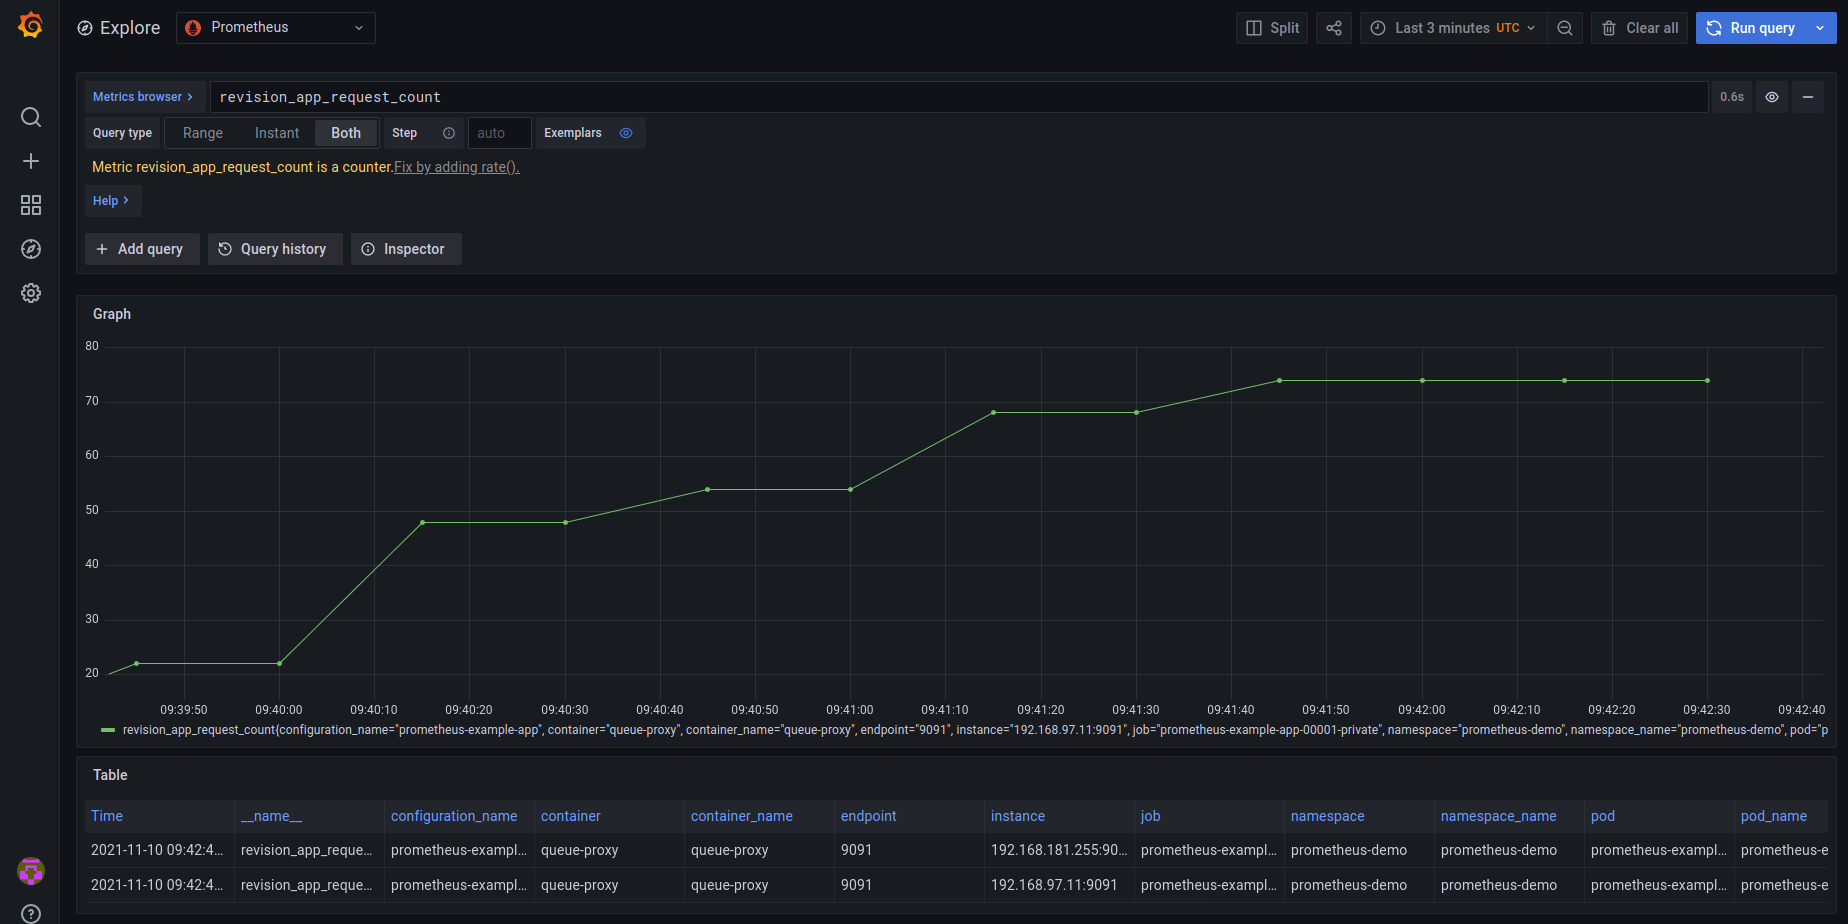
After applying this configuration, open Grafana and in the explore tab search for revision_app_request_count to visualize your application Knative metrics!