# General Dashboard Overview
# Dashboard (Kubernetes Dashboard)
Dashboard is a kube+ Platform component and runs as an application on your cluster.
Visit the Kubernetes Dashboard: https://dashboard.demo.kube-plus.cloud (opens new window)
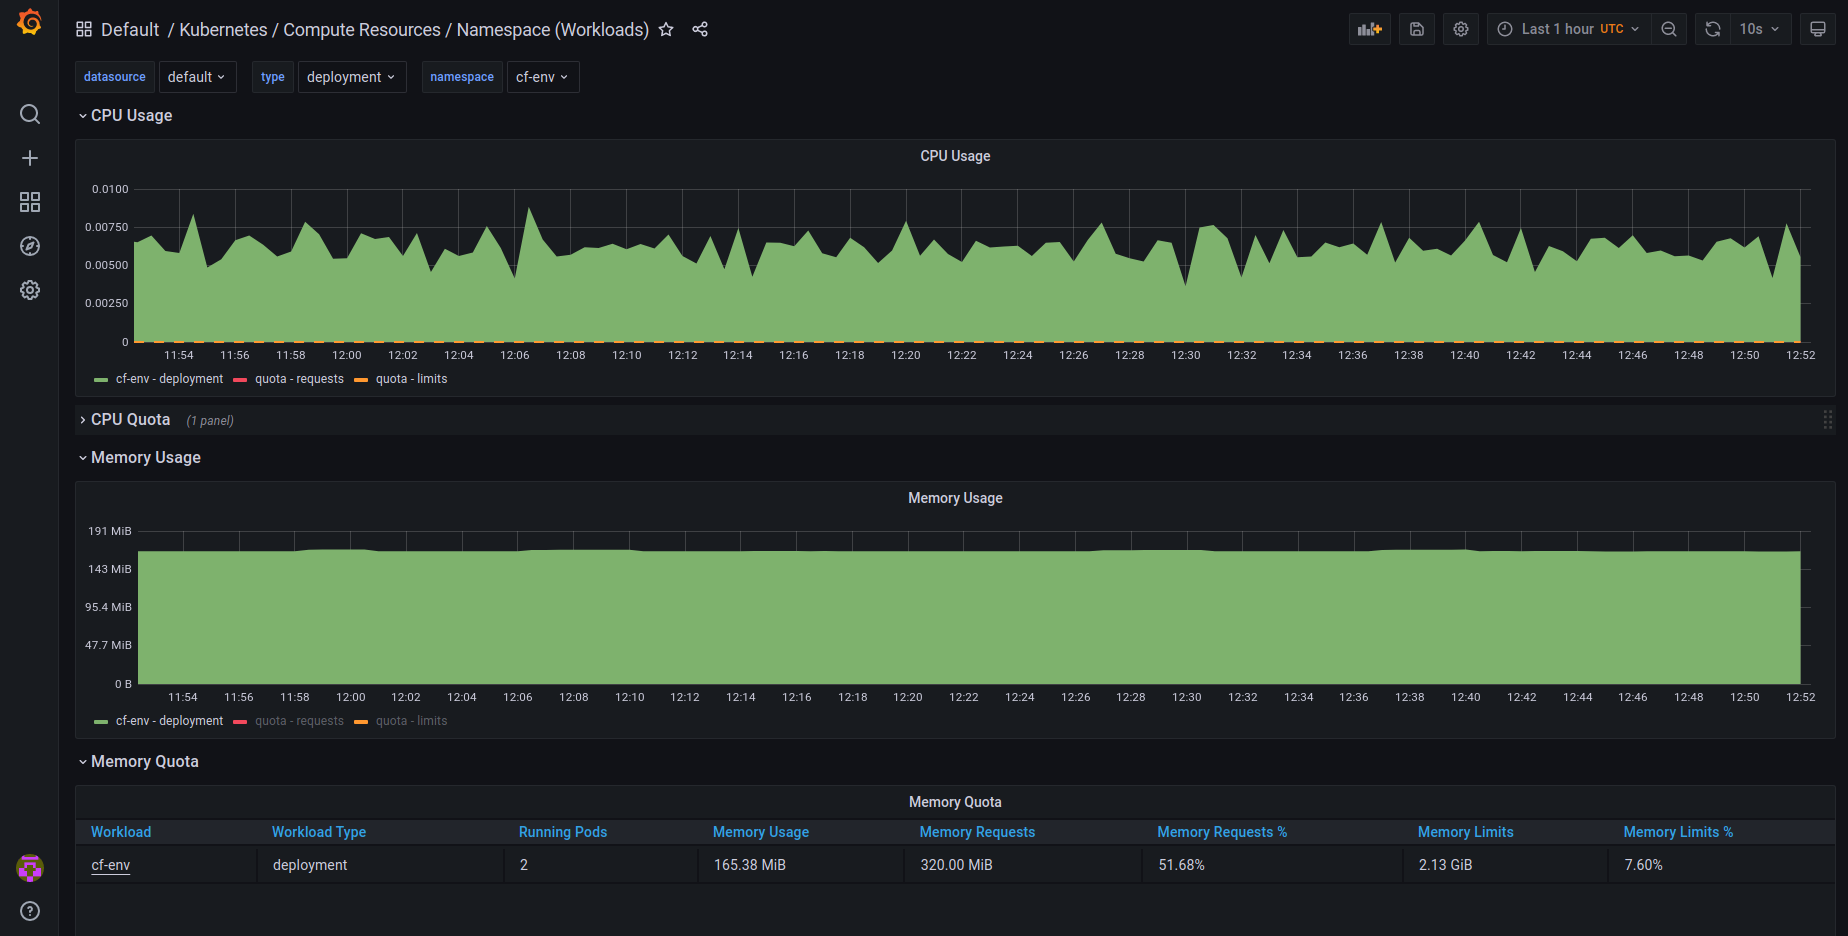
# Grafana
Grafana is a kube+ Platform component.
kube+ delivers many interesting Grafana dashboards by default. Infrastructure, application, ArgoCD, and others are already included.
Visit your Grafana Dashboard (opens new window) and discover metrics and Graphs that are included and delivered in kube+.
# Workload dashboards
# Prometheus
Prometheus is a kube+ Platform component.
Visit the Prometheus dashboard https://prometheus.demo.kube-plus.cloud (opens new window)
# Additional Kubernetes Dashboards
The built-in dashboards like Dashboard, Grafana and Prometheus covers already all the needs to have
a graphical overview about what is the state in your running kube+ cluster.
There are many other additional graphical dashboards available which helps you to have an overview of all your deployed kubernetes cluster and their components without the need to interact with the API using the kubectl command line.
Many of these tools have to be installed locally on your machine, others have to be included into the kubernetes cluster setup. Moreover, solutions such as external cloud based dashboards are also available.
The differences of these dashboards are mostly marginal since all of them try to help the same way and to give you with a few clicks a better, faster visulization of the complex system that is Kubernetes.
We picked and recommend two of them (Lens and Octant) listed further below which will run locally on your machine and are open-source-software.
They provide you quick access to the deployed components and to get logs, terminal shells into your containers, delivers metric data, health and operational state in real time. Both of these tools are using a local kubeconfig file (default ~/.kube/config) for the cluster API credentials and can be extended for a specific functionality by plugins or by extensions.
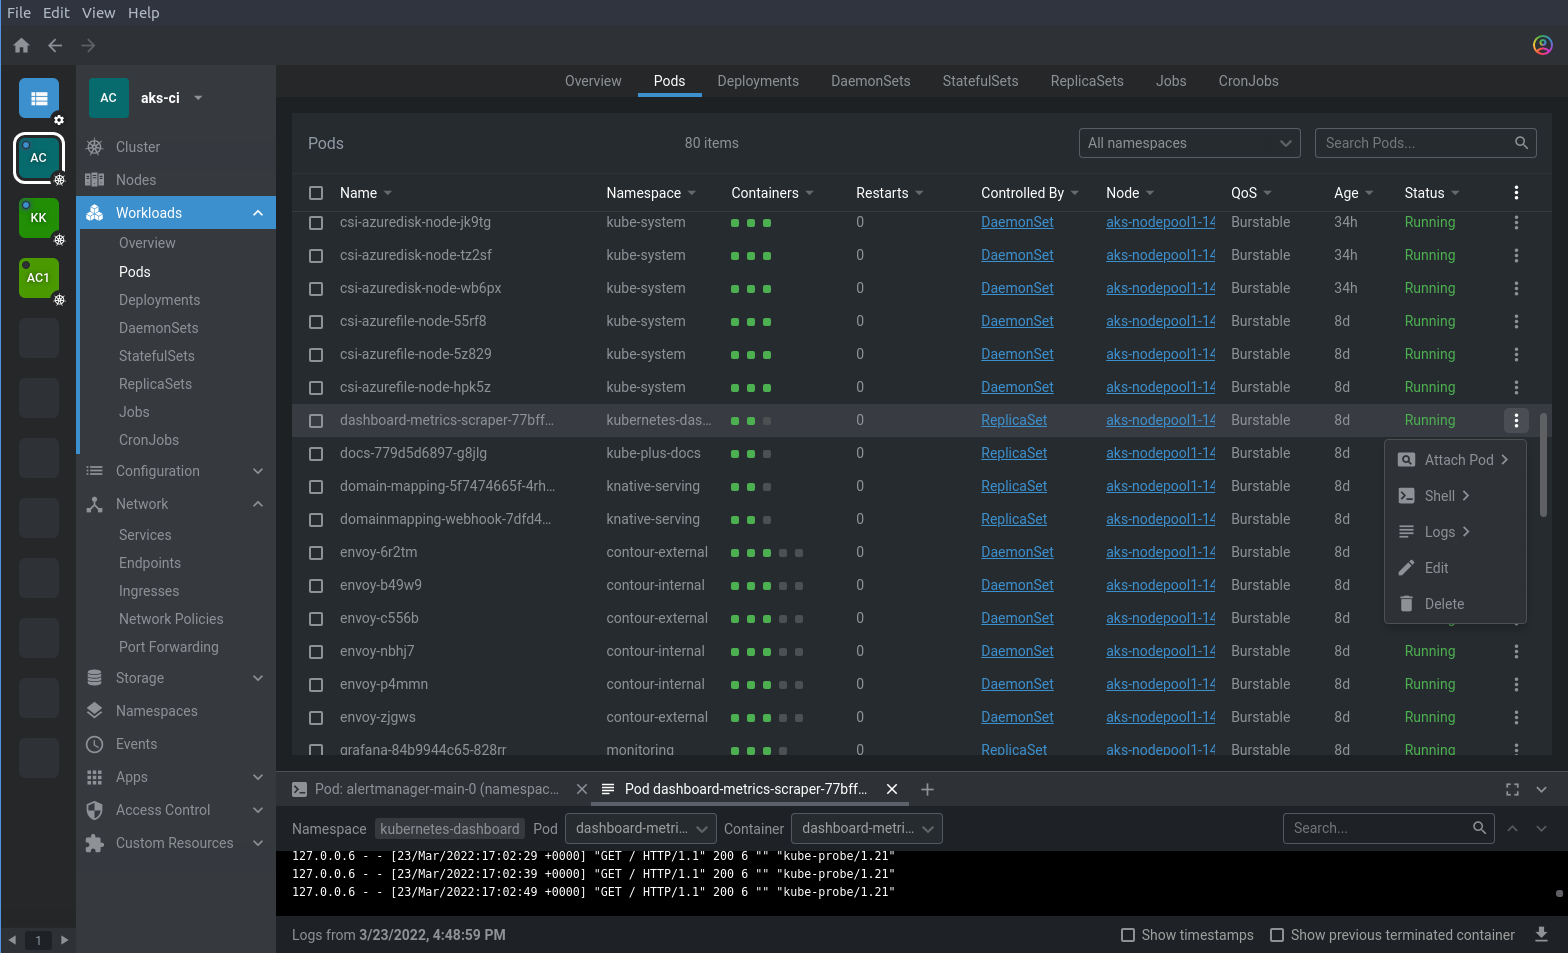
# Lens | The Kubernetes IDE (by Mirantis)
Lens is a popular Kubernetes integrated development environment (IDE). It will run as an application on your local machine.
From within the main Catalog overview you can add your clusters to the sidebar/hotbar by clicking on the right side the three dots menu. Further settings for a particular cluster like how to fetch prometheus metrics, etc. can be made within Settings also from this menu or right click the cluster icon after added to the sidebar/hotbar.
Website: https://k8slens.dev/ (opens new window)
Github: https://github.com/lensapp/lens (opens new window)
How to download/install/run (e.g. as AppImage):
$ sudo wget -O /usr/local/bin/lens https://api.k8slens.dev/binaries/latest.x86_64.AppImage
$ sudo chmod +x /usr/local/bin/lens
# start/load:
# Will start lens as an application. By default it will load all kubeconfig files in
# directory ~/.kube. Its possible to add additional configfile folders.
$ lens
# Lens Dashboard
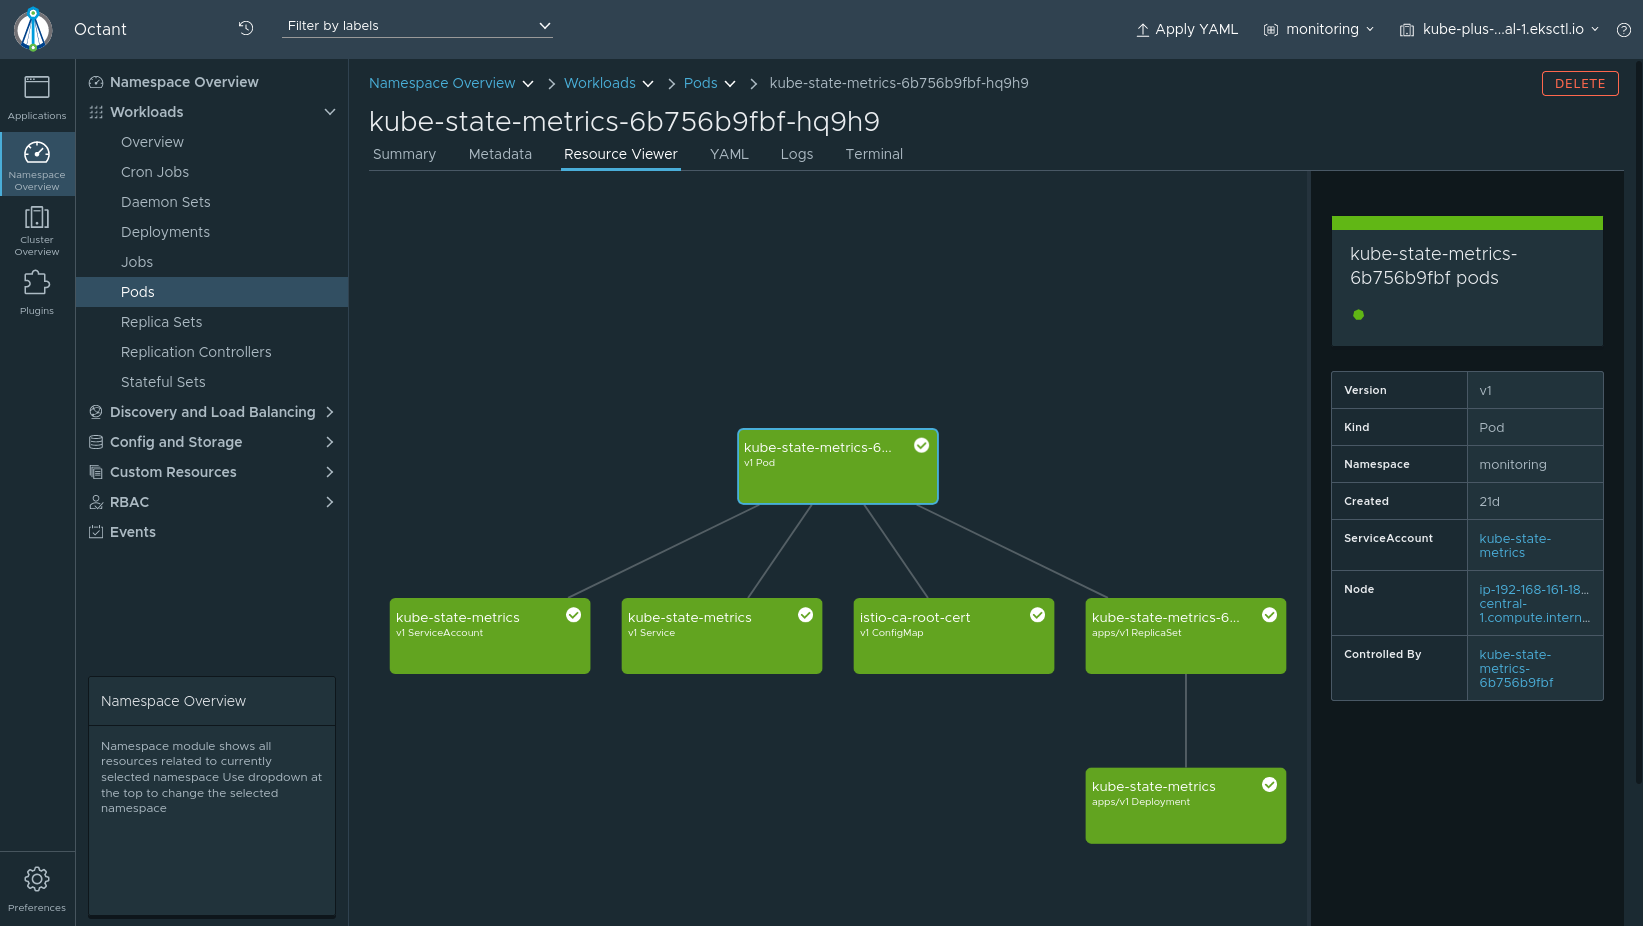
# Octant (by VMware)
Octant is accessible within a web browser or as a desktop application.
Website: https://octant.dev/ (opens new window)
Github: https://github.com/vmware-tanzu/octant (opens new window)
How to download/install/run (e.g. as AppImage):
$ sudo wget -O /usr/local/bin/octant https://github.com/vmware-tanzu/octant/releases/download/v0.25.1/Octant-0.25.1.AppImage
$ sudo chmod +x /usr/local/bin/octant
# start/load:
# Will start octant within the default webbrowser on port 7777 or if the AppsImage was
# downloaded as a desktop application.
# By default it will load ~/.kube/config. Make sure you have access
# before starting octant by testing with:
$ kubectl cluster-info
$ octant
# Octant Dashboard