# Platform Components
This chapter shortly describes the provided platform components provided by kube+.
# Keycloak
Keycloak is an open source Identity and Access Management solution aimed at modern applications and services. It makes it easy to secure applications and services with little to no code.
It comes with many useful features which are easy to use:
- Single-Sign On
- Identity Brokering and Social Login
- User Federation
- Client Adapters
- Account Management Console
- Standard Protocols (provides support for LDAP, OpenID Connect, OAuth 2.0, and SAML)
URL to the Identity and Access Management: https://auth.demo.kube-plus.cloud (opens new window) 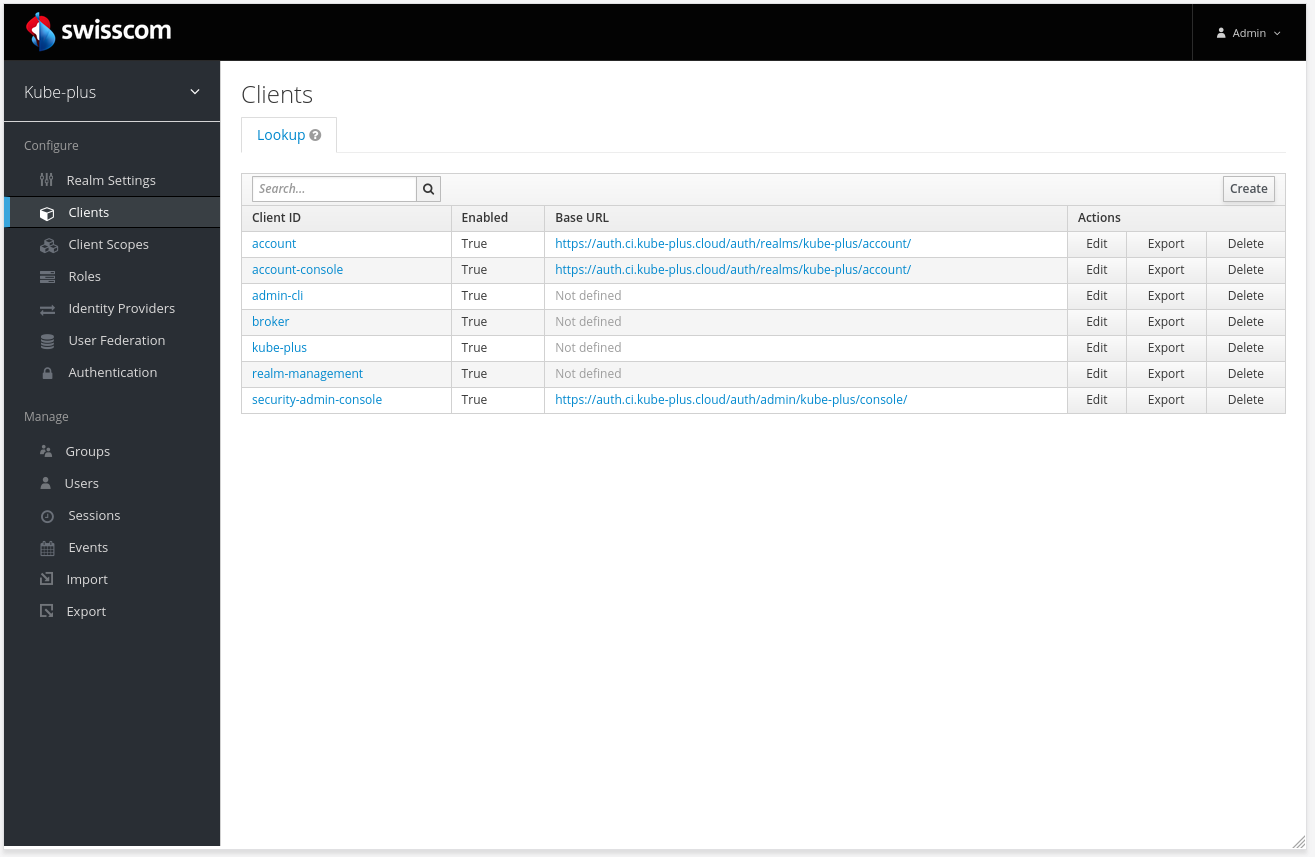
# ArgoCD
ArgoCD is a GitOps/Continuous Deployments tool which will read your environment configuration (written either as a helm chart, kustomize files, jsonnet or plain yaml files) from your git repository and apply it to your Kubernetes namespaces. Some of the features of ArgoCD are declarative and version controlled application deployments.
URL to GitOps and Continuous Deployments: https://argocd.demo.kube-plus.cloud (opens new window) 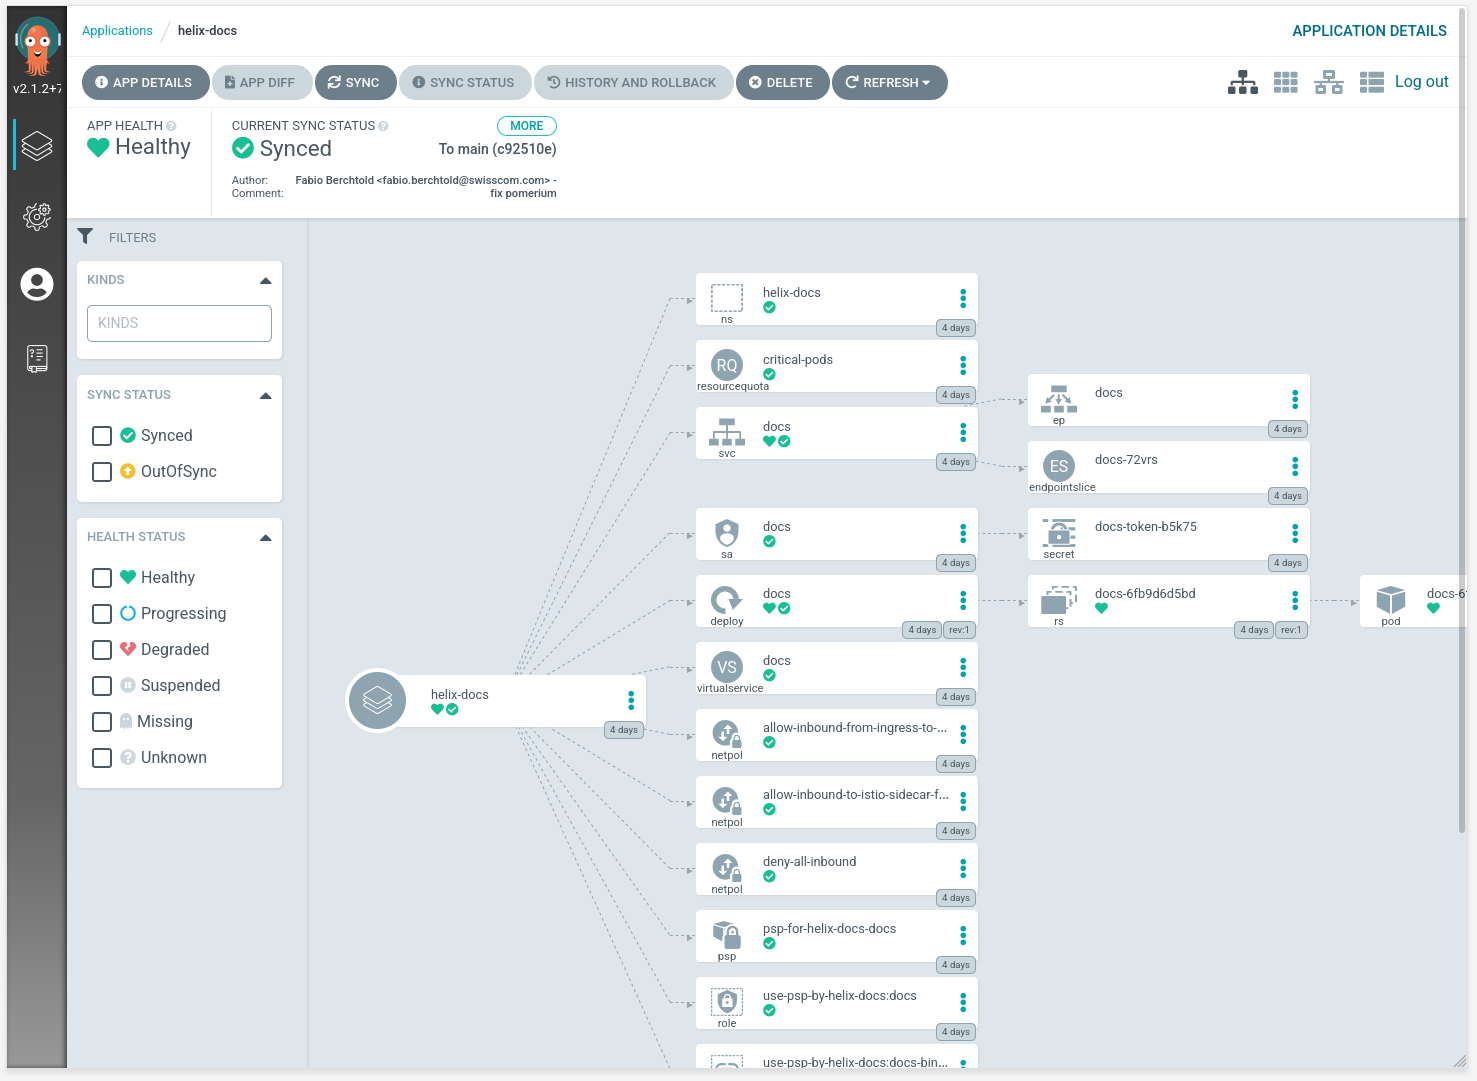
# Harbor
Harbor is an open source registry that secures artifacts with policies and role-based access control, ensures images are scanned and free from vulnerabilities, and signs images as trusted.
URL to the Image Registry: https://harbor.demo.kube-plus.cloud (opens new window) 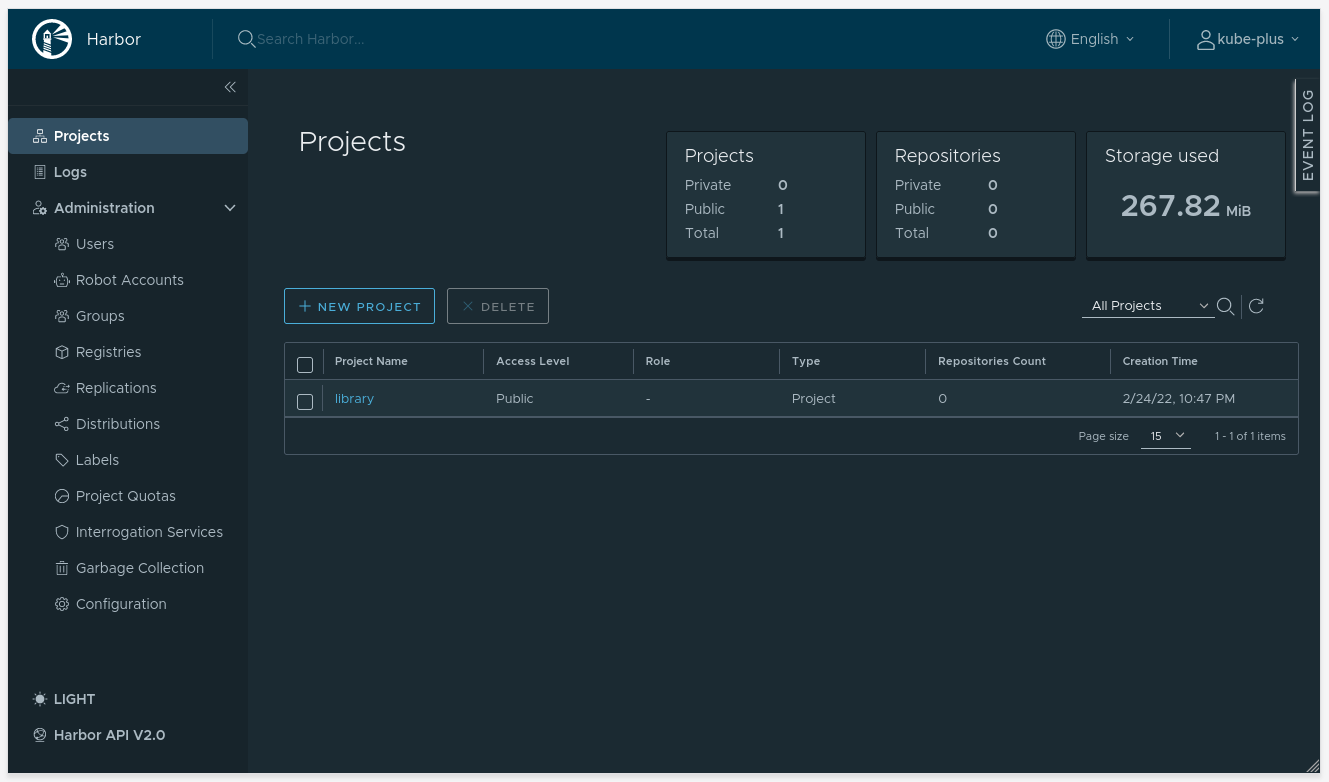
# Grafana
Grafana is an open source solution for running data analytics, pulling up metrics that make sense of the massive amount of data & to monitor our apps with the help of cool customizable dashboards.
Grafana connects with every possible data source, commonly referred to as databases such as Graphite, Prometheus, Influx DB, ElasticSearch, MySQL, PostgreSQL etc.
Grafana being an open source solution also enables us to write plugins from scratch for integration with several different data sources.
URL to the Metrics & Log Dashboard: https://grafana.demo.kube-plus.cloud (opens new window) 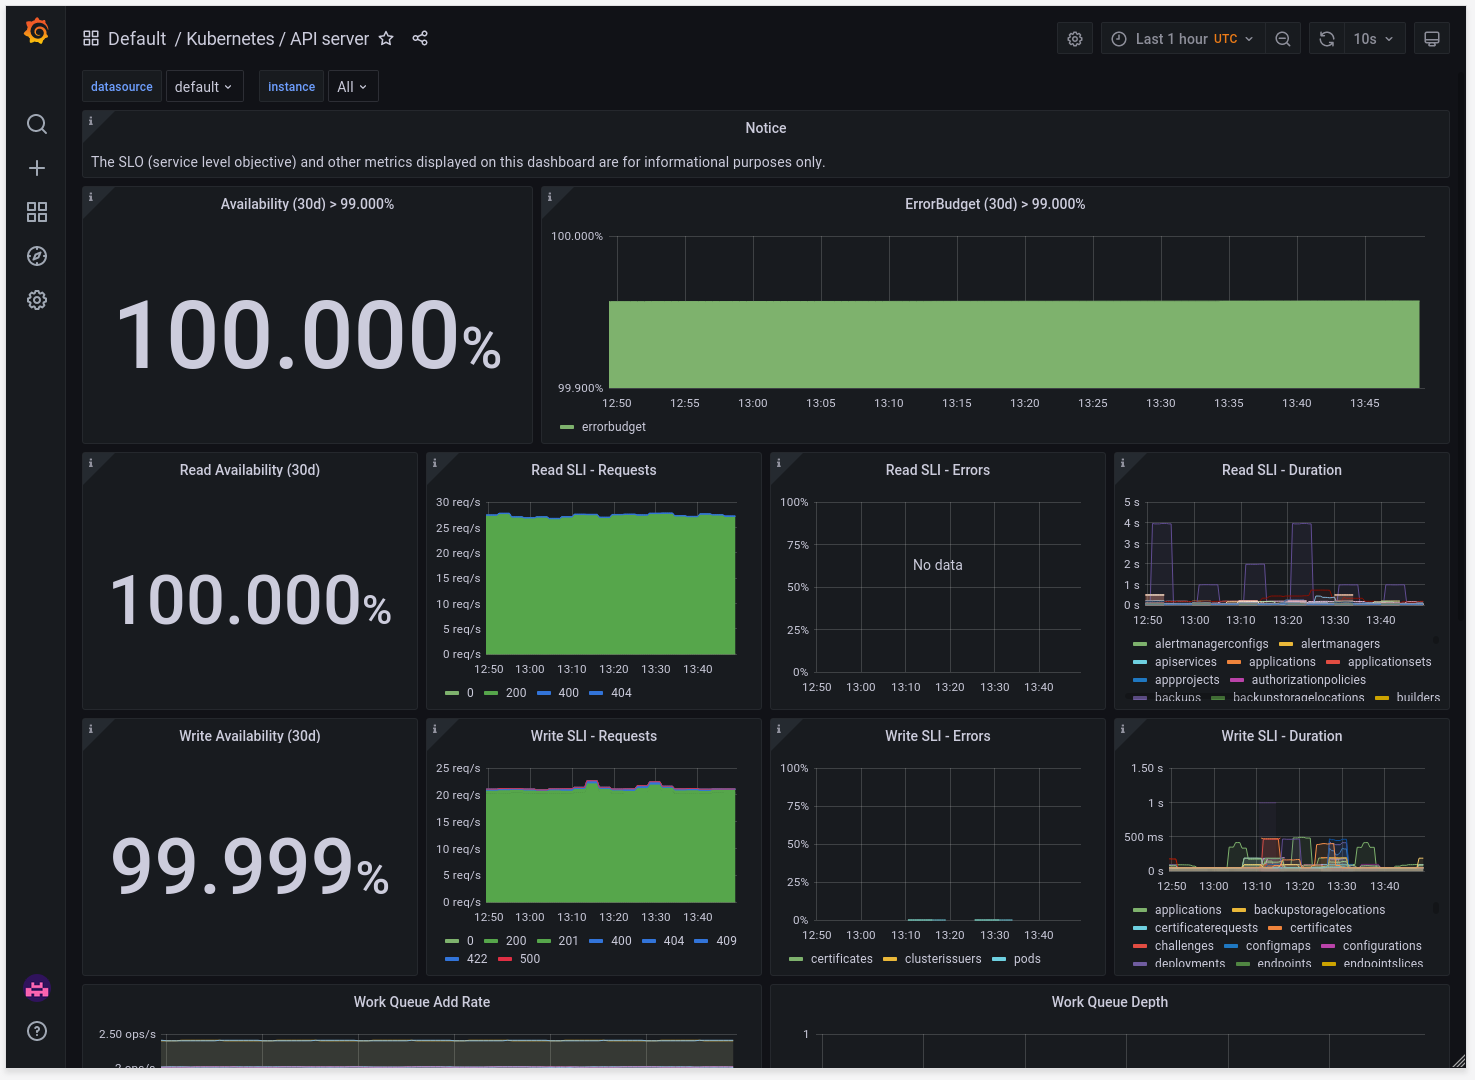
# Prometheus
Prometheus is a monitoring solution for recording and processing any purely numeric time-series. It gathers, organizes, and stores metrics along with unique identifiers and timestamps.
Prometheus is open-source software that collects metrics from targets by "scraping" metrics HTTP endpoints. Supported "targets" include infrastructure platforms (e.g. Kubernetes), applications, and services (e.g. database management systems). Together with its companion Alertmanager service, Prometheus is a flexible metrics collection and alerting tool.
URL to the Metrics & Monitoring System: https://prometheus.demo.kube-plus.cloud (opens new window) 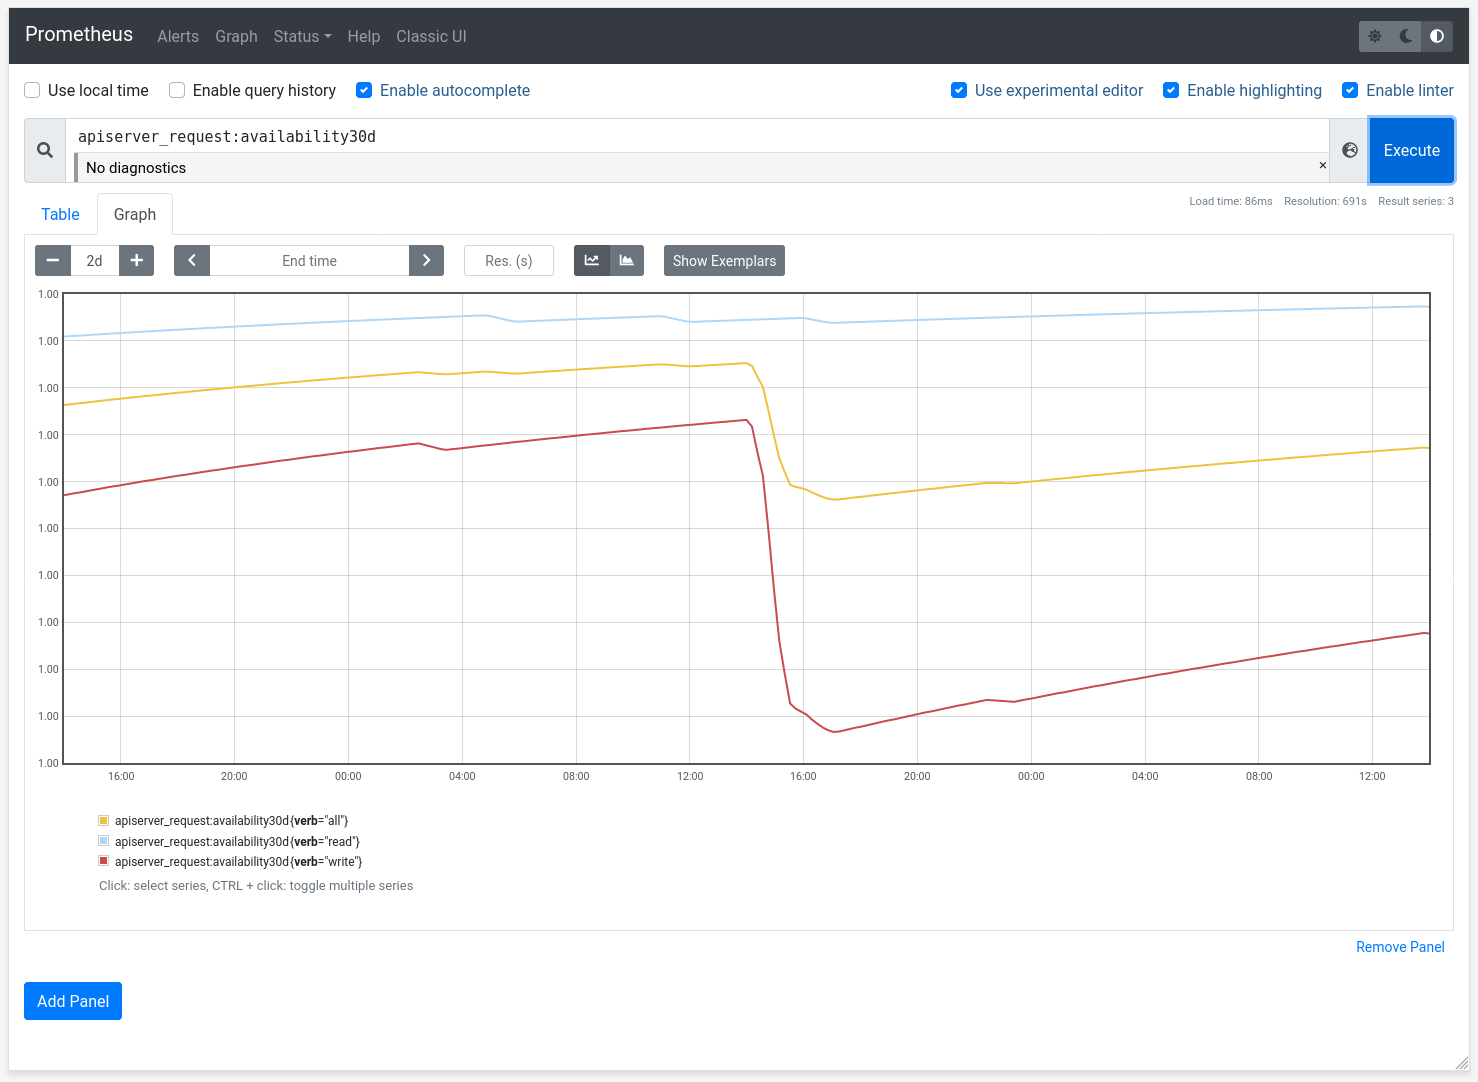
# Alertmanager
The Alertmanager handles alerts sent by client applications such as the Prometheus server. It takes care of deduplicating, grouping, and routing them to the correct receiver integration such as email, PagerDuty, or OpsGenie. It also takes care of silencing and inhibition of alerts.
URL to the Alertmanager: https://alertmanager.demo.kube-plus.cloud (opens new window) 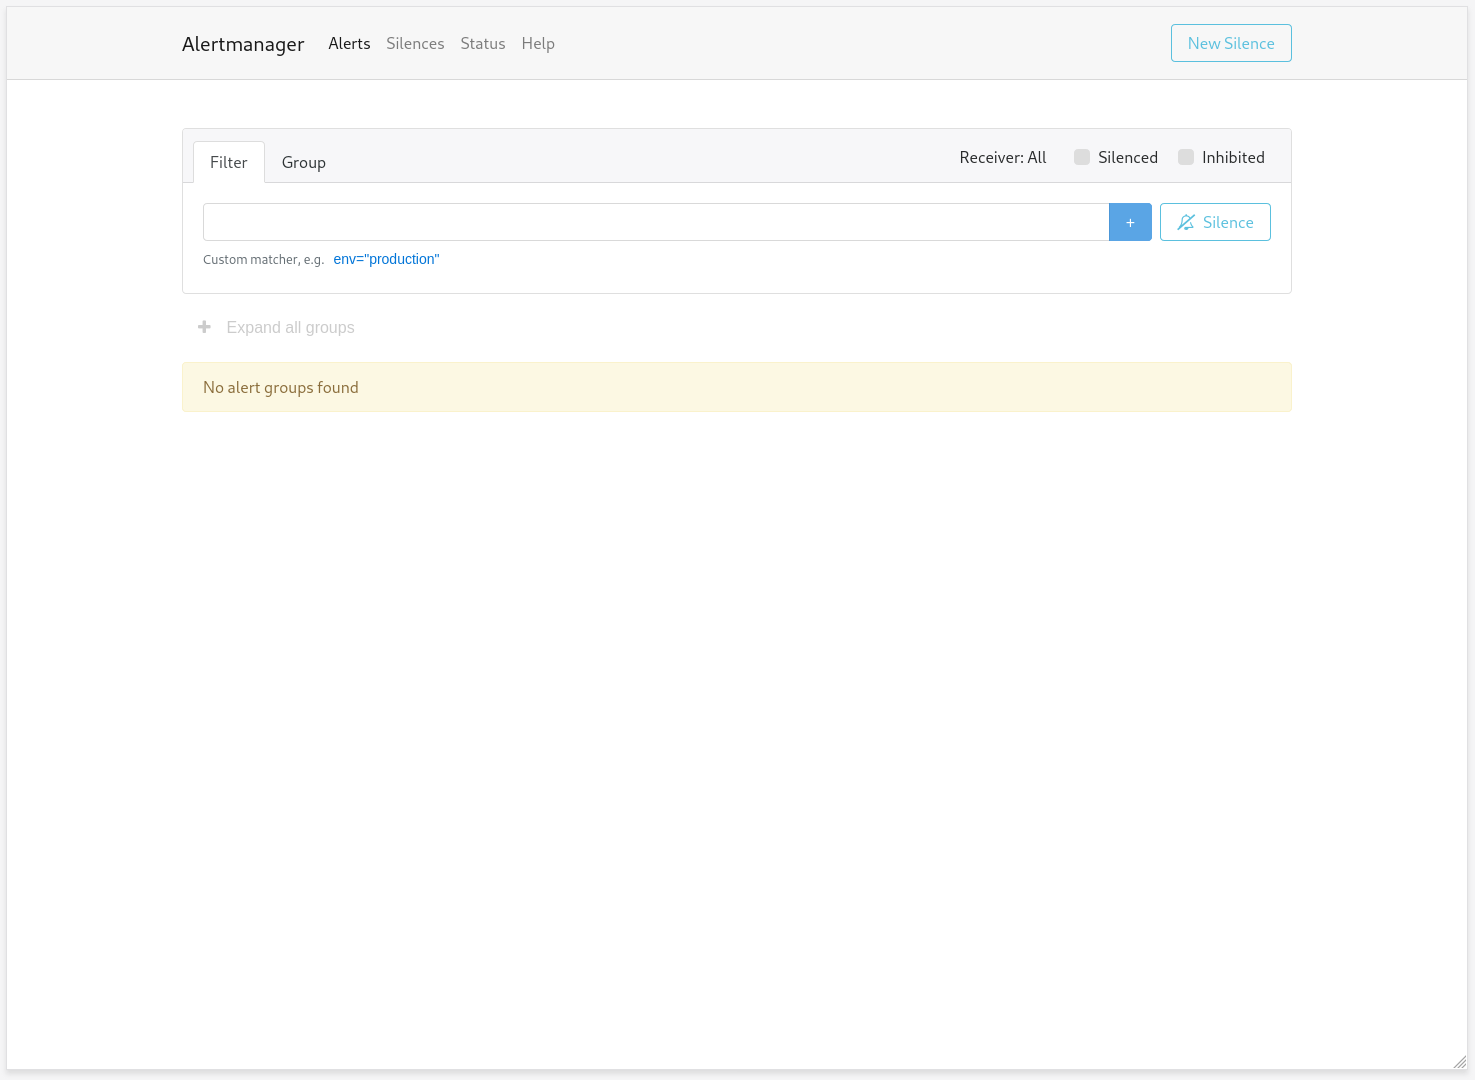
# Dashboard
Dashboard is a web-based Kubernetes user interface. You can use Dashboard to deploy containerized applications to a Kubernetes cluster, troubleshoot your containerized application, and manage the cluster resources. You can use Dashboard to get an overview of applications running on your cluster, as well as for creating or modifying individual Kubernetes resources (such as Deployments, Jobs, DaemonSets, etc).
For example, you can scale a Deployment, initiate a rolling update, restart a pod or deploy new applications using a deploy wizard.
Dashboard also provides information on the state of Kubernetes resources in your cluster and on any errors that may have occurred.
URL to the Kubernetes Dashboard: https://dashboard.demo.kube-plus.cloud (opens new window) 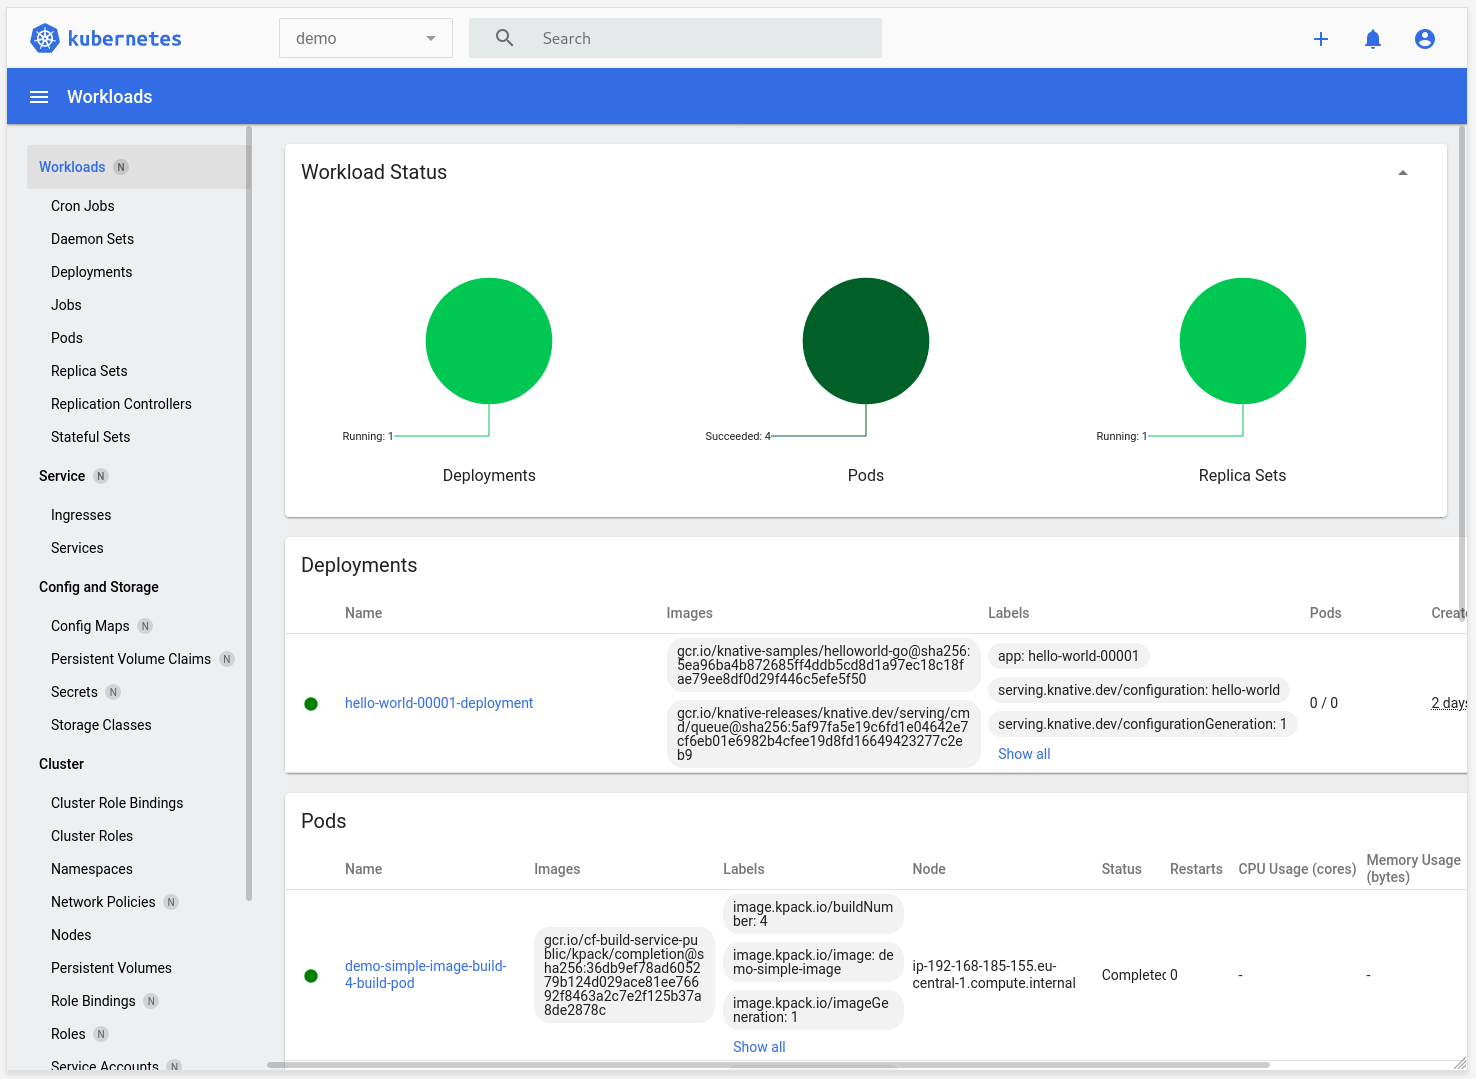
This Kubernetes "Dashboard" runs as an application on your cluster. If you are interested on dashboards to have an overview of all your deployed clusters then take a look to these recommended tools: Additional Kubernetes Dashboards